

2020 Bridging Trends Revealed
Annual bridging lending fell by £278 million due to Covid-19 disruption but the market is showing signs of recovery, Bridging Trends data reveals.
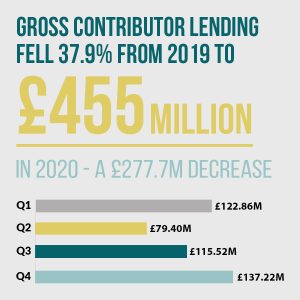
£455 million of bridging loans were transacted by Bridging Trends contributors in 2020, a 38% decrease on the previous year (£732.7m).
The impact of Covid-19 was most evident in the first half of the year when national lockdown measures were implemented, and the housing market practically ground to a halt.
£112.86m in bridging loans were transacted by contributors in Q1 2020, before volumes plummeted to £79.4m in the second quarter as restrictions continued.
Encouragingly, volumes increased in the second half of the year to £115.52m in Q3 2020 and to £137.22m in Q4 2020.
Historically, a significant portion of bridging loan activity is unregulated but in 2020, there was a near equal split between regulated and unregulated transactions – with regulated bridging transactions increasing market share to an average of 49.4% of gross lending in 2020, compared with 39% in 2019, and 36% in 2018.
As the mortgage market struggles to cope with increased demand, bridging lenders have been able to step in and fill the gap to meet the needs of homebuyers.
Average monthly interest rates increased in the first quarter of the year to 0.8%, before peaking at 0.85% in Q2. However, the second half of the year saw a sharp drop in pricing with the average monthly rate falling to 0.78% in Q3 and then 0.72% in the fourth quarter – the lowest ever rate recorded by Bridging Trends since its launch in 2015.
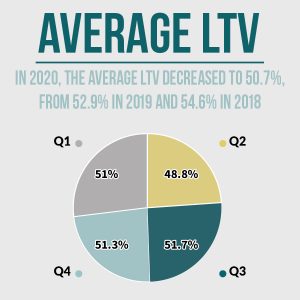
Encouragingly, the average loan-to-value also fell to 50.7% in 2020, down from 52.9% in 2019 and 55.6% in 2018. This could be due to bridging lenders pulling back on high LTV products, as well as a change in risk appetite due to market uncertainty.
Second-charge loans accounted for an average of 23% of the market in 2020, up from 20% in 2019 and 17% in 2018. This 3% year-on-year increase reflects a strong lending trend.
The second quarter of the year saw second-charge transactions peak to the highest level recorded, at 26.1% of gross loan volume. This could be attributed to business owners investing to support their businesses over lockdown.
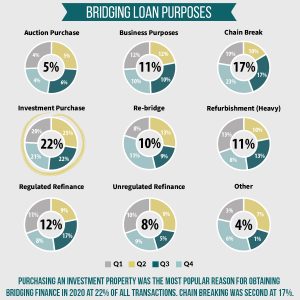
Funding an investment purchase was the most popular reason for obtaining bridging finance in the first three quarters of the year. However, in the fourth quarter, a traditional chain break was the most popular purpose, accounting for 23% of all transactions. This reflected the slow processing times in the mortgage market as borrowers tried to take advantage of the stamp duty deadline.
The average loan term in 2020 was 12 months, the same as in 2019. The average completion time averaged 50 days, up from 47 days in 2019 and 45 days in 2018.
Bridging Trends is a quarterly publication developed by MT Finance, covering data gathered from several packagers operating within the UK bridging finance market: Adapt Finance, Brightstar Financial, Capital B, Clever Lending, Complete FS, Enness, Finanta, Impact Specialist Finance, Sirius Group, and UK Property Finance.
Click here to view the 2020 Bridging Trends infographic or to view its archives.