2019 Bridging Trends revealed
Despite 2019’s political uncertainty, demand for bridging finance remained remarkably stable, according to the latest Bridging Trends data.
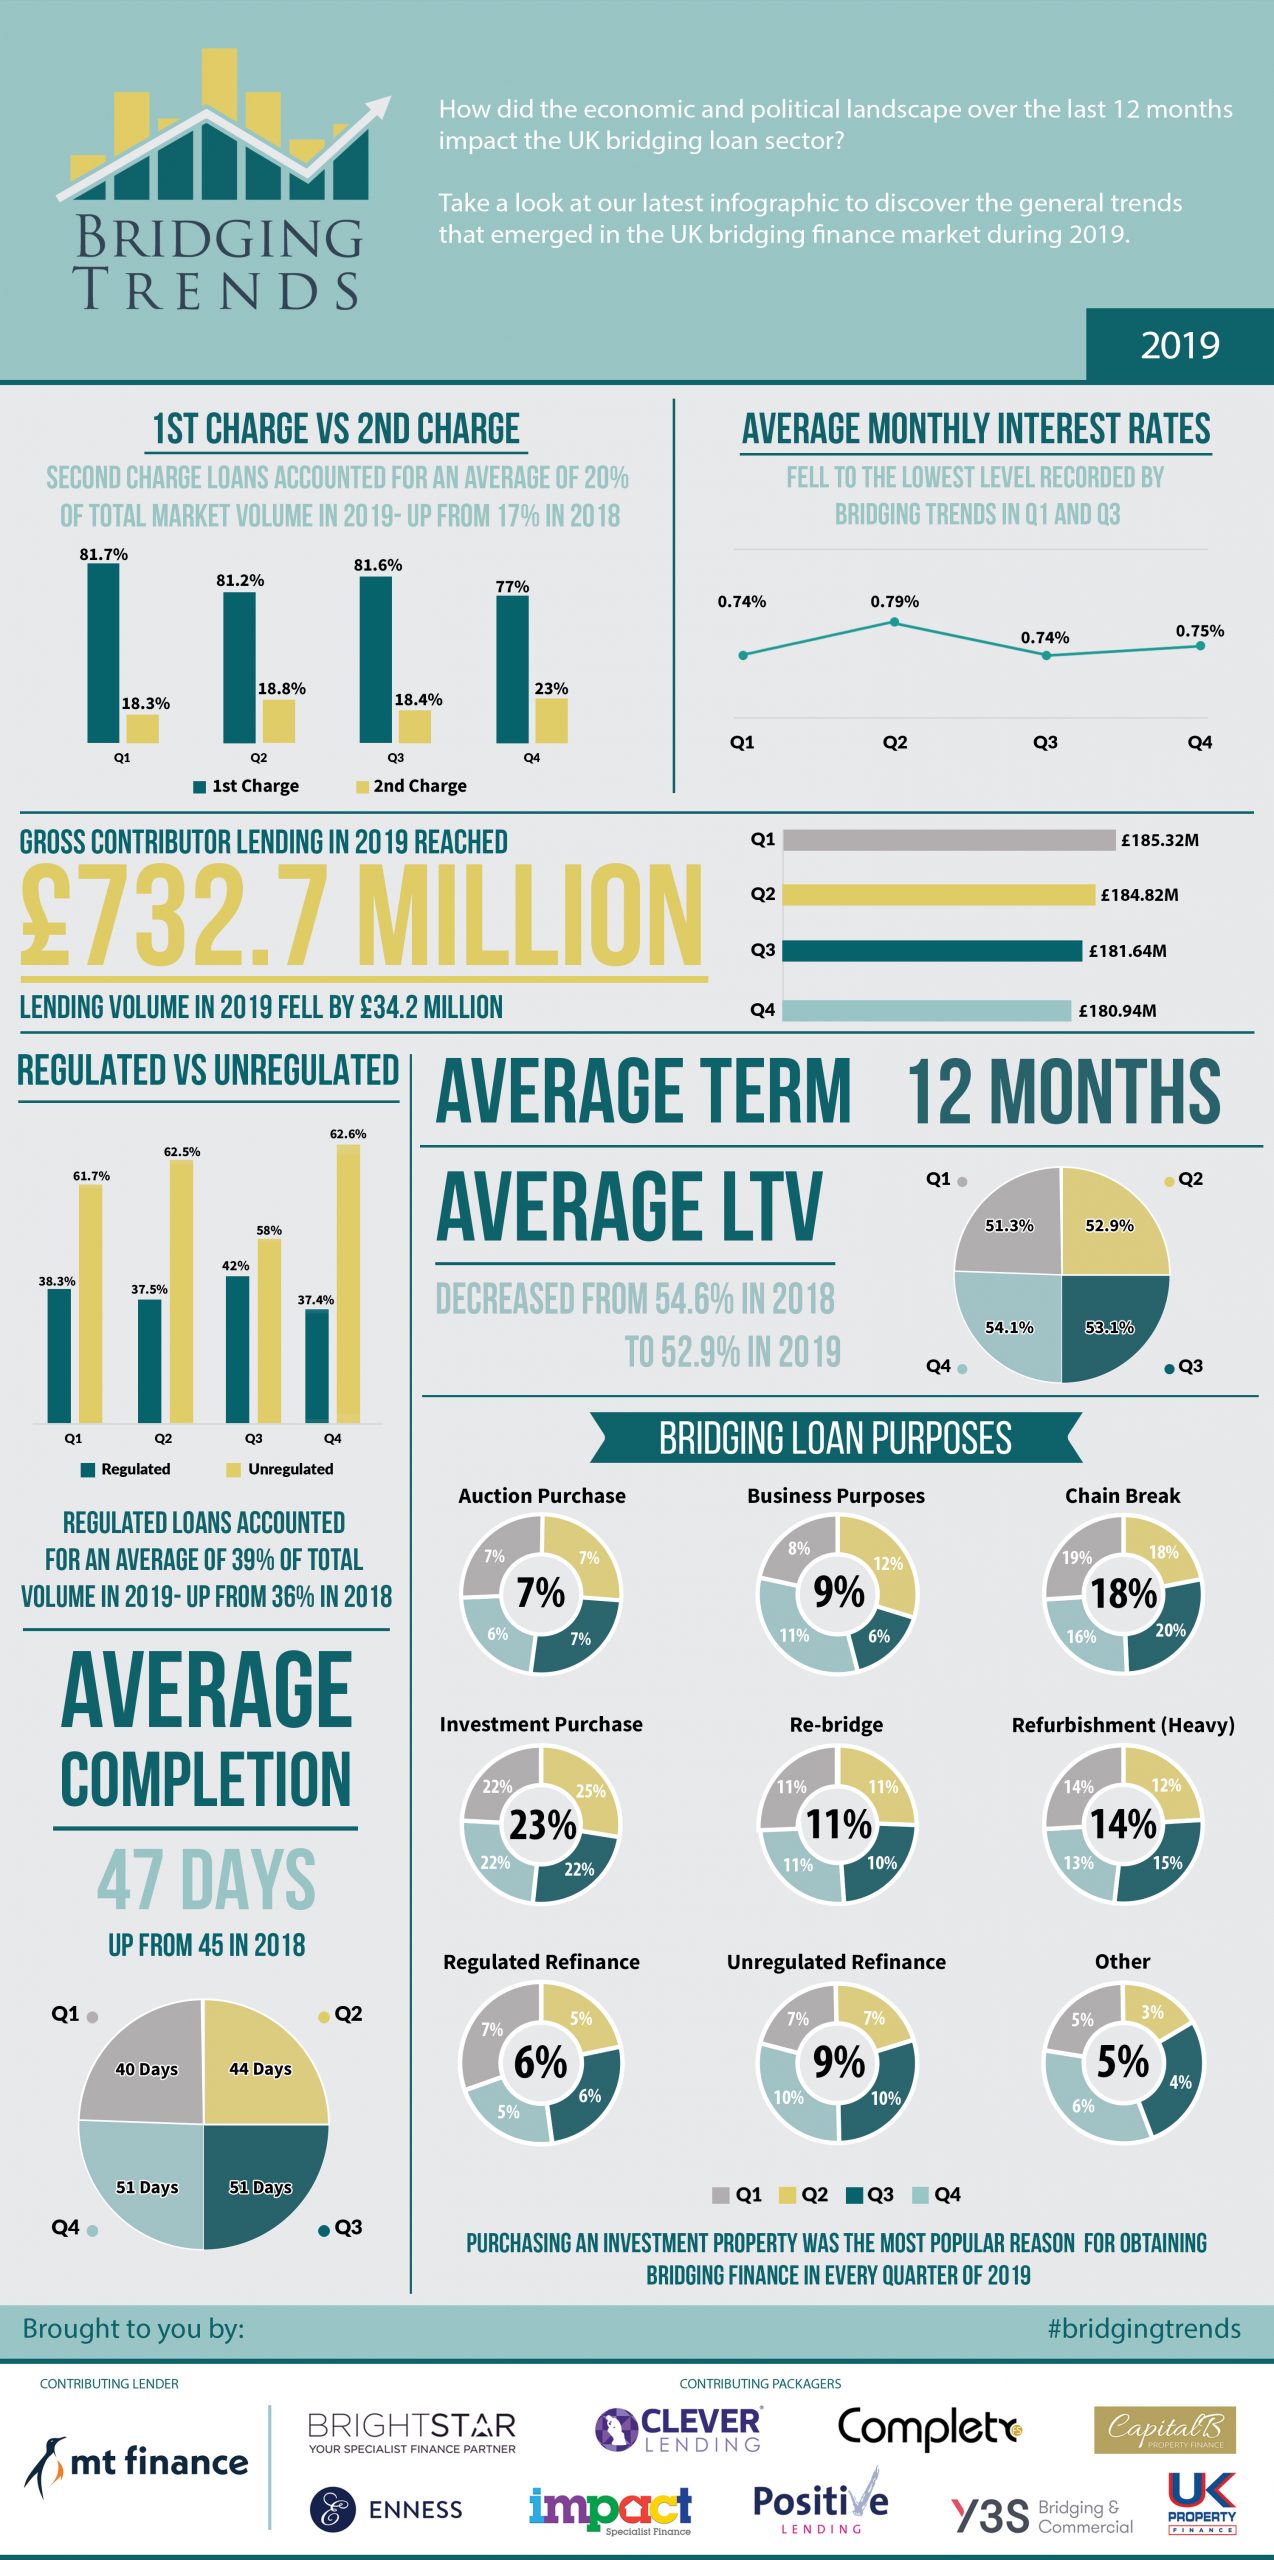
Some £732.7m of bridging loans were transacted by contributors in 2019, a 4.5% decrease on the previous year (£766.9 million). The year kicked off to a strong start, with £185.32 million of bridging loans completed by Bridging Trends contributors in the first quarter, before cooling slightly in the second half of the year, dropping to £181.64 million in Q3 and to £180.94 million in Q4.
Whilst a significant portion of bridging loan activity was unregulated in 2019, at an average of 64% of all transactions, regulated bridging loans increased market share to an average of 39% in 2019, compared to 36% in 2018.
average bridging loan rates fall to lowest level
Average monthly interest rates continue to fall year-on-year, highlighting the large levels of liquidity in a continually competitive space. The average monthly interest rate in 2019 was 0.76%, lower than in 2018 (0.81%), 2017 (0.83%) and 2016 (0.85%).
Encouragingly, average loan-to-value levels also decreased in 2019 to an average of 53%, from 55% LTV in 2018, suggesting borrowers are not over-stretching themselves.
The split between 1st and 2nd legal charge bridging loans remained consistent in the first three quarters of the year, before second charge loans soared to the highest level ever recorded by Bridging Trends in the fourth quarter – up from 18.4% in Q3 2019 to 23% in Q4 2019.
Second charge bridging loans accounted for an average of 20% of total market volume in 2019 – up from 17% in 2018 and 2017.
Funding an investment purchase was the most popular reason for obtaining bridging finance throughout the year, accounting for 23% of all loans. Borrowers took advantage of election uncertainty, opting for fast and flexible bridging loans to purchase property, with a traditional chain break the second most popular reason for taking out a bridging loan, accounting for 18% of all loans in 2019.
The average loan term was 12 months, up from 11 months in 2018. The average completion time averaged 47 days in 2019, up from 45 days in 2018, and 43 days in 2017.
key bridging trends in 2019:
- Average monthly interest rates continue to fall year-on-year
- Regulated bridging loans increased market share
- 2nd charge loans saw highest market volume in 2019
- Average LTV levels fell to an average of 53%
Despite a disruptive year for the property market owing to the political uncertainty, the figures provided for 2019 were encouraging. Property professionals have continued to utilise bridging finance as a tool to support their investment. We have also seen heavy refurbishment continue to grow as investors and developers look to maximise their capital returns.
It will be interesting to see how next quarter’s figures will be affected as visibility on Brexit continues to improve.
To view the Bridging Trends 2019 infographic, please visit www.bridgingtrends.com