

bridging finance demand up despite traditional seasonal slowdown
Bridging finance experienced a massive 33% increase in lending activity during the third quarter, spurning the summer slowdown and the impact of wider global macro volatility, according to the latest Bridging Trends data.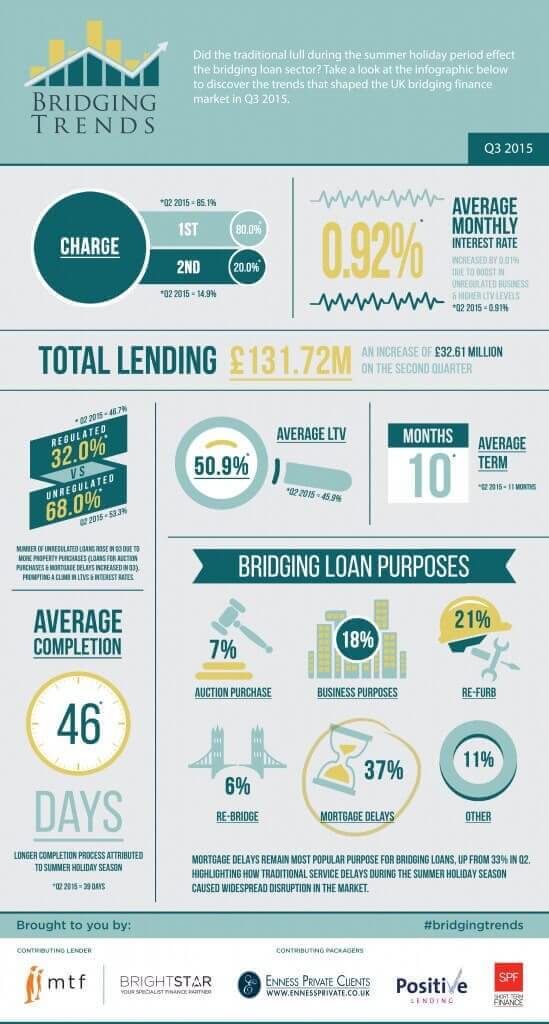
Contributor lending activity climbed to £131.7m during the third quarter of 2015, from £99.1m during the second quarter as demand for short term lending grew, Bridging Trends data showed.
Demand for bridging finance was strong as borrowers continued to tap short term liquidity, especially to plug the funding gap left by mainstream lenders implementing tougher affordability restrictions.
For the second consecutive quarter, mortgage delays were the most popular reason for accessing a bridging loan, rising to 37% of all lending, from 33% during Q2 2015. Refurbishment was the second most popular reason for getting a bridging loan, contributing to 21% of all lending.
First charge lending remained solid, indicating a significant investment in residential properties-to-let, while second legal charge lending for the quarter rose to 20%, from 14.9% during Q2 2015.
Average LTV climbed to 50.9% in Q3, impacted by a boost in unregulated business, which rose to 68% in Q3 2015 from 53.3% in Q2 2015.
The average completion time on a bridging loan application jumped to 46 days during the third quarter from 39 during the second quarter, as service and resource levels were impacted by annual leave.
The average term of a bridging loan was 10 months in the third quarter, down from 11 months in both the first and second quarters.
Key data points from Bridging Trends in Q3 of 2015 are as follows:
- Total contributor lending reached £131.72m- an increase of 32.9%
- Average term fell by a month to 10 months
- Average monthly interest rate increased by 0.01%
- Average LTV increased in the third quarter to 50.9%
- 32% of bridging loans were regulated in Q3, down from 46.7% in Q2
We believe the recent data is interesting as we are beginning to see a degree of consistency in the key market parameters we are seeking to benchmark. The percentage of first charge business versus second charge, the average monthly interest rates, average terms, and the LTV data shown in the first three quarterly reports are all sufficiently consistent to begin to give us reliable insight into the bridging finance market.
We are however, surprised to see the average number of days being taken to complete a bridging loan lengthening out further from what already appeared to be a rather extended period of 39 days as per the Q2 results. This may be a seasonal anomaly and we are interested to see how this figure will shift as we move into the final quarter of the year.
Bridging Trends is a quarterly data publication conducted and compiled by MTF, Brightstar Financial, Enness Private Clients, Positive Lending and SPF Short-term Finance to monitor the latest trends in bridging finance. For more information or to view the previous quarter’s trends, please visit www.bridgingtrends.com