annual Bridging Trends revealed
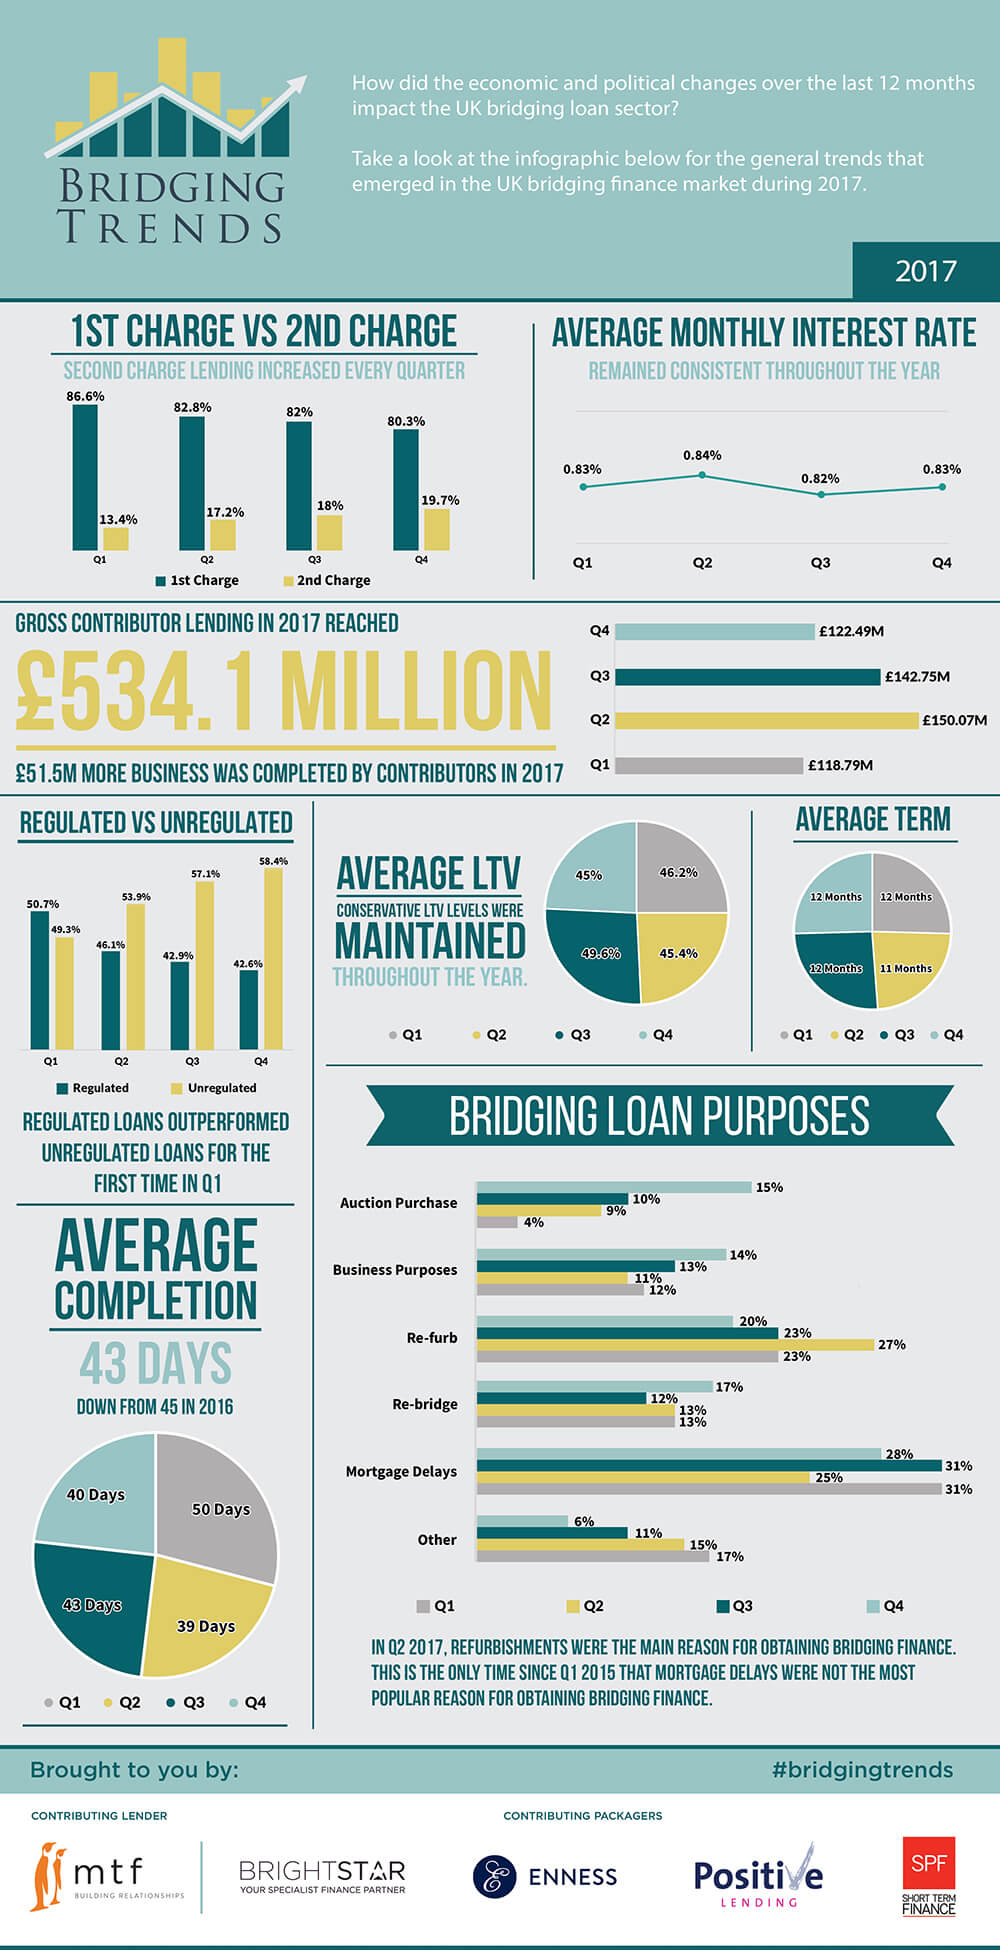
Bridging loan volume rose 10.7% to £534.1m in 2017, compared to £482.61m in 2016 as demand for short term finance in the UK grew, according to the latest Bridging Trends data.
The increase in 2017 volume continues a trend seen in 2016, when activity rose 11.5% on 2015 levels of £432.51m.
The bridging loan market withstood volatility from major political and economic events throughout 2017, which included a snap general election, an increase in inflation and continued uncertainty over Brexit negotiations.
The year kicked off to a strong start, with £118.79m of bridging loans completed by Bridging Trends contributors in the first quarter, before soaring to £150.7m in the second quarter — the highest level of loans transacted by contributors in a single quarter since Bridging Trends launched in 2015.
Volume cooled slightly in the second half of the year, dropping to £142.75m in Q3 and to £122.49m in Q4.
Bridging Trends is a quarterly publication that collects data from bridging lender mtf and a number of the UK’s leading specialist finance brokers: Brightstar Financial, Enness, Positive Lending and SPF Short Term Finance (SPF), to offer a general snapshot of the UK bridging finance industry as a whole.
The split between 1st and 2nd charge loans remained consistent throughout 2017, with 2nd charge lending rising in every quarter. Second charges accounted for an average of 17% of total market volume in 2017 — up from 16% in 2016.
While a significant portion of bridging loan activity was unregulated in 2017, at an average of 54% of all transactions, regulated bridging loans increased market share on previous years to an average of 46% in 2017, compared to 44% in 2016 and 36.6% in 2015.
Regulated bridging loan activity outperformed unregulated bridging loans for the first time in the first quarter of 2017.
Average loan-to-value levels dropped to 46.6% in 2017, down from 49% in 2016 -highlighting that responsible lending levels continue.
Average monthly interest rates remained consistent throughout the year at 0.83%, dropping slightly from 0.85% in 2016 and 0.91% in 2015, demonstrating how bridging finance has become even more competitive.
Mortgage delays were again the most popular reason for clients taking out a bridging loan in 2017- at 29% of all lending, although this was a reduction from 2016 when they accounted for 34% of activity.
Demand for bridging loans taken out for refurbishments and auction purchases on the other hand increased in 2017.
Average loan terms remained consistent in 2017 at 12 months- up from 11 months in 2016. Average completion times averaged 43 days in 2017, down from 45 days in 2016.
For more information please visit www.bridgingtrends.com